Anexo:Países por producción de zinc
Esta es una lista de países por producción de zinc en su mayoría basada del Servicio Geológico de Estados Unidos según su producción de anual zinc en toneladas métricas.
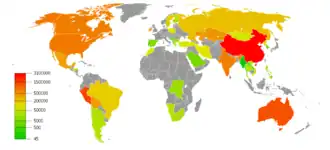
Producción mundial de zinc
Países productores de zinc

1.- Áncash con el 39,8%
2.- Junín con el 18,8%
3.- Pasco con el 13,6%
4.- Lima con el 9,5 %
5.- Ica con el 8,5%
6.- Ayacucho con el 4,2%
7.- Arequipa con el 2,7 %
8.- Huánuco con el 1,2%
9.- Huancavelica con el 0,9%
10.- Cuzco con el 0,2%
11.- Puno con el 0,1%

1.- Potosí con el 86,5%
2.- Oruro con el 5,7%
3.- La Paz con el 5,0%
4.- Chuquisaca con el 2,0 %
5.- Cochabamba con el 0,5%
| N° | Países productores de ZINC |
Continente | Producción de 2022 en Toneladas[1] |
% a Nivel Mundial |
|---|---|---|---|---|
| TOTAL | MUNDO | — | 12 610 536 ton. | 100 % |
| 1° | Asia | 4 041 000 ton. | 32,02 % | |
| 2° | América | 1 369 532 ton. | 10,86 % | |
| 3° | Oceanía | 1 243 715 ton. | 9,87 % | |
| 4° | América | 877 000 ton. | 6,96 % | |
| 5° | Asia | 832 194 ton. | 6,60 % | |
| 6° | América | 761 000 ton. | 6,03 % | |
| 7° | América | 517 523 ton. | 4,10 % | |
| 8° | Asia | 315 100 ton. | 2,50 % | |
| 9° | Europa | 293 000 ton. | 2,23 % | |
| 10° | Europa | 233 958 ton. | 1,85 % | |
| 11° | África | 224 356 ton. | 1,77 % | |
| 12° | Asia | 186 000 ton. | 1,47 % | |
| 13° | Europa | 182 262 ton. | 1,44 % | |
| 14° | América | 150 000 ton. | 1,18 % | |
| 15° | Asia | 150 000 ton. | 1,18 % | |
| 16° | África | 120 529 ton. | 0,95 % | |
| 17° | América | 116 533 ton. | 0,92 % | |
| 18° | Asia | 103 600 ton. | 0,82 % | |
| 19° | Europa | 103 300 ton. | 0,82 % | |
| 20° | Europa | 82 963 ton. | 0,66 % | |
| 21° | Europa | 62 433 ton. | 0,49 % | |
| 22° | Asia | 59 056 ton. | 0,47 % | |
| 23° | América | 52 000 ton. | 0,41 % | |
| 24° | Asia | 42 349 ton. | 0,33 % | |
| 25° | Asia | 42 000 ton. | 0,33 % | |
| 26° | África | 40 500 ton. | 0,32 % | |
| 27° | África | 40 000 ton. | 0,32 % | |
| 28° | África | 35 000 ton. | 0,28 % | |
| 29° | Europa | 29 506 ton. | 0,23 % | |
| 30° | Asia | 28 000 ton. | 0,22 % | |
| 31° | América | 25 500 ton. | 0,20 % | |
| 32° | Asia | 24 700 ton. | 0,19 % | |
| 33° | América | 24 092 ton. | 0,19 % | |
| 34° | África | 23 200 ton. | 0,18 % | |
| 35° | África | 20 000 ton. | 0,16 % | |
| 36° | Asia | 18 000 ton. | 0,14 % | |
| 37° | África | 14 613 ton. | 0,11 % | |
| 38° | Asia | 14 000 ton. | 0,11 % | |
| 39° | Europa | 13 762 ton. | 0,11 % | |
| 40° | Asia | 12 000 ton. | 0,09 % | |
| 41° | Asia | 11 400 ton. | 0,09 % | |
| 42° | Europa | 10 502 ton. | 0,08 % | |
| 43° | Europa | 8 100 ton. | 0,06 % | |
| 44° | Europa | 7 000 ton. | 0,05 % | |
| 45° | Europa | 6 500 ton. | 0,05 % | |
| 46° | Europa | 6 300 ton. | 0,04 % | |
| 47° | Europa | 5 967 ton. | 0,04 % | |
| 48° | Europa | 5 718 ton. | 0,04 % | |
| 49° | Europa | 5 629 ton. | 0,04 % | |
| 50° | América | 5 485 ton. | 0,04 % | |
| 51° | Europa | 4 412 ton. | 0,03 % | |
| 52° | Asia | 3 959 ton. | 0,03 % | |
| 53° | América | 3 893 ton. | 0,03 % | |
| 54° | África | 900 ton. | 0,00 % | |
| 55° | África | 400 ton. | 0,00 % | |
| 56° | Europa | 95 ton. | 0,00 % | |
| Fuente : British Geological Survey (Servicio Geológico Británico) [2] | ||||
Países productores de zinc per cápita
| N° | País o Región | Continente | Producción de Zinc Per Cápita en 2022 (en Kilogramos)[1] |
Población (Habitantes en 2022) [3] |
|---|---|---|---|---|
| 1° | Oceanía | 47,8 kilos por habitante | 26 005 540 | |
| 2° | América | 42,3 kilos por habitante | 12 224 110 | |
| 3° | América | 40,2 kilos por habitante | 34 049 588 | |
| 4° | África | 32,7 kilos por habitante | 3 684 032 | |
| 5° | Asia | 30,4 kilos por habitante | 3 398 366 | |
| 6° | Europa | 22,3 kilos por habitante | 10 486 941 | |
| 7° | Europa | 20,1 kilos por habitante | 5 127 170 | |
| 8° | Europa | 17,5 kilos por habitante | 10 409 704 | |
| 9° | Asia | 16,5 kilos por habitante | 19 621 972 | |
| 10° | África | 15,7 kilos por habitante | 2 567 012 | |
| 11° | Europa | 14,3 kilos por habitante | 2 057 679 | |
| 12° | Europa | 13,1 kilos por habitante | 617 213 | |
| 13° | Europa | 11,2 kilos por habitante | 5 556 106 | |
| 14° | América | 6,87 kilos por habitante | 127 504 125 | |
| 15° | Asia | 5,93 kilos por habitante | 9 952 787 | |
| 16° | América | 4,63 kilos por habitante | 11 212 191 | |
| 17° | África | 3,74 kilos por habitante | 59 893 885 | |
| 18° | África | 3,34 kilos por habitante | 5 970 424 | |
| 19° | Europa | 3,24 kilos por habitante | 1 761 985 | |
| 20° | América | 2,99 kilos por habitante | 38 929 902 | |
| 21° | Asia | 2,86 kilos por habitante | 1 412 175 000 | |
| 22° | América | 2,44 kilos por habitante | 10 432 860 | |
| 23° | Asia | 2,39 kilos por habitante | 7 529 475 | |
| 24° | América | 2,28 kilos por habitante | 333 287 557 | |
| 25° | Asia | 2,18 kilos por habitante | 84 979 913 | |
| 26° | Europa | 2,14 kilos por habitante | 2 780 469 | |
| 27° | Europa | 2,12 kilos por habitante | 6 465 097 | |
| 28° | Europa | 2,03 kilos por habitante | 144 236 933 | |
| 29° | Europa | 1,74 kilos por habitante | 3 233 526 | |
| 30° | Europa | 1,73 kilos por habitante | 47 778 340 | |
| 31° | Asia | 1,69 kilos por habitante | 88 550 570 | |
| 32° | América | 1,22 kilos por habitante | 19 603 733 | |
| 33° | Europa | 1,18 kilos por habitante | 3 712 502 | |
| 34° | Asia | 1,17 kilos por habitante | 35 648 100 | |
| 35° | Asia | 1,07 kilos por habitante | 26 069 416 | |
| 36° | África | 1,02 kilos por habitante | 22 673 762 | |
| 37° | Europa | 1,00 kilos por habitante | 10 426 919 | |
| 38° | Europa | 0,97 kilos por habitante | 6 664 449 | |
| 39° | África | 0,93 kilos por habitante | 37 457 971 | |
| 40° | América | 0,69 kilos por habitante | 215 313 498 | |
| 41° | Asia | 0,67 kilos por habitante | 36 408 820 | |
| 42° | Asia | 0,58 kilos por habitante | 1 417 173 170 | |
| 43° | América | 0,48 kilos por habitante | 11 228 821 | |
| 44° | Europa | 0,36 kilos por habitante | 19 047 009 | |
| 45° | Asia | 0,22 kilos por habitante | 54 179 306 | |
| 46° | África | 0,18 kilos por habitante | 218 541 212 | |
| 47° | Europa | 0,17 kilos por habitante | 36 821 749 | |
| 48° | Asia | 0,17 kilos por habitante | 235 824 862 | |
| 49° | África | 0,14 kilos por habitante | 99 010 212 | |
| 50° | Asia | 0,14 kilos por habitante | 98 186 856 | |
| 51° | América | 0,08 kilos por habitante | 46 234 830 | |
| 52° | Asia | 0,07 kilos por habitante | 51 628 117 | |
| 53° | Asia | 0,04 kilos por habitante | 275 501 339 | |
Países productores de zinc en América
- : Desde 1 000 000 de toneladas para arriba
- : Entre 500 000 y 1 000 000 de toneladas
- : Entre 100 000 y 500 000 toneladas
- : Entre 10 000 y 100 000 toneladas
- : Entre 1 000 y 10 000 toneladas
- : Entre 100 y 1 000 toneladas
- : Desde 100 toneladas para abajo
- : Sin Producción
| LISTA DE LOS PAÍSES DE AMÉRICA SEGÚN SU PRODUCCIÓN ANUAL DE ZINC DURANTE LA DÉCADA DE 1980 (Años 80s) MEDIDO EN TONELADAS MÉTRICAS FINAS | |||||||||||||
|---|---|---|---|---|---|---|---|---|---|---|---|---|---|
| N.º | Países de América |
Año 1980 |
Año 1981 |
Año 1982 |
Año 1983 |
Año 1984 |
Año 1985 |
Año 1986 |
Año 1987 |
Año 1988 |
Año 1989 |
Año 1990 |
TOTAL 1980 - 1990 |
| 1° | 1 058 714 | 1 096 257 | 1 189 129 | 1 069 709 | 1 207 098 | 1 172 238 | 1 290 765 | 1 481 544 | 1 347 424 | 1 216 139 | 1 203 161 | 13 332 178 ton. | |
| 2° | 487 596 | 496 707 | 507 100 | 553 100 | 568 300 | 582 600 | 597 576 | 612 477 | 485 429 | 597 412 | 583 934 | 6 072 231 ton. | |
| 3° | 317 103 | 312 418 | 303 160 | 296 700 | 277 500 | 251 900 | 220 800 | 232 900 | 256 400 | 288 300 | 543 200 | 3 300 381 ton. | |
| 4° | 238 231 | 211 629 | 231 910 | 257 444 | 290 236 | 275 412 | 271 351 | 271 480 | 262 228 | 284 058 | 322 487 | 2 916 466 ton. | |
| 5° | 105 000 | 96 582 | 111 882 | 119 843 | 113 691 | 123 811 | 123 942 | 132 962 | 155 531 | 178 439 | 158 025 | 1 419 708 ton. | |
| 6° | 50 260 | 47 423 | 45 684 | 46 453 | 36 815 | 38 205 | 33 296 | 39 292 | 56 957 | 74 789 | 103 849 | 573 023 ton. | |
| 7° | 33 681 | 35 150 | 36 635 | 36 586 | 34 909 | 35 713 | 39 540 | 35 648 | 36 849 | 43 155 | 38 664 | 406 530 ton. | |
| 8° | 19 559 | 19 065 | 24 381 | 38 000 | 44 480 | 50 916 | 22 674 | 16 644 | 23 475 | 33 676 | 28 971 | 321 841 ton. | |
| 9° | 1 134 | 1 516 | 5 656 | 5 993 | 19 168 | 22 288 | 10 504 | 19 618 | 19 182 | 18 370 | 25 146 | 148 575 ton. | |
| LISTA DE LOS PAÍSES DE AMÉRICA SEGÚN SU PRODUCCIÓN ANUAL DE ZINC DURANTE LA DÉCADA DE 1990 (Años 90s) MEDIDO EN TONELADAS MÉTRICAS FINAS | |||||||||||||
| N.º | Países de América |
Año 1990 |
Año 1991 |
Año 1992 |
Año 1993 |
Año 1994 |
Año 1995 |
Año 1996 |
Año 1997 |
Año 1998 |
Año 1999 |
Año 2000 |
TOTAL 1990 - 2000 |
| 1° | 1 203 161 | 1 156 582 | 1 324 675 | 1 004 367 | 1 010 712 | 1 121 172 | 1 222 386 | 1 076 385 | 1 061 645 | 1 020 982 | 1 002 242 | 12 204 309 ton. | |
| 2° | 583 934 | 627 824 | 602 614 | 664 552 | 690 017 | 692 290 | 760 353 | 867 691 | 868 757 | 899 524 | 910 303 | 8 167 859 ton. | |
| 3° | 543 200 | 546 600 | 551 667 | 513 075 | 597 576 | 643 877 | 628 063 | 631 900 | 755 000 | 852 200 | 851 900 | 7 115 058 ton. | |
| 4° | 322 487 | 300 706 | 289 119 | 366 432 | 358 953 | 363 658 | 377 599 | 379 252 | 395 391 | 362 807 | 392 791 | 3 909 195 ton. | |
| 5° | 158 025 | 130 000 | 149 000 | 171 800 | 177 585 | 188 472 | 117 341 | 152 634 | 87 475 | 98 590 | 100 254 | 1 531 176 ton. | |
| 6° | 103 849 | 129 778 | 143 936 | 122 638 | 100 742 | 146 131 | 145 092 | 154 491 | 152 110 | 146 316 | 149 134 | 1 494 217 ton. | |
| 7° | 38 664 | 39 253 | 40 978 | 31 395 | 26 933 | 32 104 | 31 093 | 33 357 | 35 560 | 34 192 | 34 858 | 378 387 ton. | |
| 8° | 28 971 | 38 280 | 32 702 | 24 276 | 23 611 | 27 117 | 37 037 | 39 483 | 36 639 | 40 996 | 43 064 | 372 176 ton. | |
| 9° | 25 146 | 30 998 | 29 730 | 29 435 | 31 038 | 35 403 | 36 004 | 33 934 | 15 943 | 32 263 | 31 403 | 331 297 ton. | |
| LISTA DE LOS PAÍSES DE AMÉRICA SEGÚN SU PRODUCCIÓN ANUAL DE ZINC DURANTE LA DÉCADA DE 2000 (Años 2000s) MEDIDO EN TONELADAS MÉTRICAS FINAS | |||||||||||||
| N.º | Países de América |
Año 2000 |
Año 2001 |
Año 2002 |
Año 2003 |
Año 2004 |
Año 2005 |
Año 2006 |
Año 2007 |
Año 2008 |
Año 2009 |
Año 2010 |
TOTAL 2000 - 2010 |
| 1° | 910 303 | 1 056 629 | 1 221 616 | 1 372 790 | 1 209 006 | 1 201 671 | 1 203 364 | 1 444 354 | 1 602 597 | 1 512 931 | 1 470 450 | 14 205 711 ton. | |
| 2° | 1 002 242 | 1 064 744 | 916 220 | 788 063 | 791 373 | 666 664 | 637 956 | 630 485 | 750 502 | 699 145 | 649 065 | 8 596 459 ton. | |
| 3° | 851 900 | 842 100 | 780 000 | 767 600 | 738 900 | 747 900 | 727 100 | 803 300 | 778 100 | 736 000 | 748 100 | 8 521 000 ton. | |
| 4° | 392 791 | 428 828 | 446 104 | 413 991 | 426 360 | 476 307 | 479 400 | 452 012 | 453 588 | 489 766 | 570 004 | 5 029 151 ton. | |
| 5° | 149 134 | 141 226 | 141 558 | 144 985 | 145 906 | 158 582 | 172 747 | 214 053 | 383 618 | 430 879 | 411 409 | 2 494 097 ton. | |
| 6° | 100 254 | 111 432 | 136 339 | 152 822 | 158 962 | 170 659 | 185 211 | 193 899 | 173 933 | 172 688 | 211 203 | 1 767 402 ton. | |
| 7° | 43 064 | 48 485 | 46 339 | 43 766 | 41 413 | 42 698 | 37 646 | 29 211 | 28 462 | 36 370 | 33 839 | 431 293 ton. | |
| 8° | 31 403 | 32 762 | 36 161 | 33 051 | 27 635 | 28 841 | 36 238 | 36 453 | 40 519 | 27 801 | 27 662 | 358 526 ton. | |
| 9° | 34 858 | 39 703 | 37 325 | 29 839 | 27 220 | 30 227 | 29 808 | 27 025 | 30 349 | 31 869 | 32 600 | 350 823 ton. | |
| LISTA DE LOS PAÍSES DE AMÉRICA SEGÚN SU PRODUCCIÓN ANUAL DE ZINC DURANTE LA DÉCADA DE 2010 (Años 10s) MEDIDO EN TONELADAS MÉTRICAS FINAS | |||||||||||||
| N.º | Países de América |
Año 2010 |
Año 2011 |
Año 2012 |
Año 2013 |
Año 2014 |
Año 2015 |
Año 2016 |
Año 2017 |
Año 2018 |
Año 2019 |
Año 2020 |
TOTAL 2010 - 2020 |
| 1° | 1 470 450 | 1 256 383 | 1 281 282 | 1 351 273 | 1 315 000 | 1 421 218 | 1 337 081 | 1 473 073 | 1 474 383 | 1 382 753 | 1 334 570 | 15 097 466 ton. | |
| 2° | 748 100 | 768 900 | 738 400 | 784 400 | 832 000 | 824 700 | 804 800 | 773 800 | 824 000 | 753 000 | 723 000 | 8 575 100 ton. | |
| 3° | 570 004 | 631 859 | 660 349 | 642 542 | 659 878 | 786 774 | 661 646 | 671 444 | 662 355 | 859 194 | 1 008 252 | 7 814 297 ton. | |
| 4° | 411 409 | 429 518 | 391 315 | 412 037 | 450 542 | 443 172 | 489 293 | 527 206 | 519 630 | 529 115 | 359 695 | 4 962 932 ton. | |
| 5° | 649 065 | 622 600 | 641 134 | 426 545 | 352 125 | 289 584 | 301 210 | 346 776 | 304 964 | 323 019 | 371 491 | 4 628 513 ton. | |
| 6° | 211 203 | 197 840 | 164 258 | 152 147 | 169 766 | 157 000 | 158 200 | 156 500 | 169 800 | 163 000 | 173 167 | 1 872 881 ton. | |
| 7° | 27 662 | 36 602 | 26 762 | 29 759 | 45 094 | 48 071 | 42 870 | 29 008 | 26 810 | 5 620 | 28 662 | 346 920 ton. | |
| 8° | 32 600 | 38 000 | 42 000 | 47 650 | 47 981 | 33 787 | 26 680 | 23 392 | 22 050 | 16 407 | 8 569 | 339 116 ton. | |
| 9° | 33 839 | 26 000 | 26 000 | 25 000 | 30 000 | 24 988 | 14 579 | 20 436 | 28 421 | 29 223 | 27 000 | 285 486 ton. | |
| 10° | 0 | 0 | 0 | 0 | 0 | 0 | 0 | 2 900 | 42 000 | 57 800 | 57 700 | 160 400 ton. | |
| 11° | 0 | 0 | 442 | 1 221 | 13 394 | 14 810 | 14 975 | 6 100 | 0 | 0 | 0 | 50 942 ton. | |
| 12° | 0 | 0 | 0 | 0 | 0 | 4 655 | 3 636 | 3 920 | 4 038 | 5 527 | 2 361 | 24 137 ton. | |
| LISTA DE LOS PAÍSES DE AMÉRICA SEGÚN SU PRODUCCIÓN ANUAL DE ZINC DURANTE LA DÉCADA DE 2020 (Años 20s) MEDIDO EN TONELADAS MÉTRICAS FINAS | |||||||||||||
| N.º | Países de América |
Año 2020 |
Año 2021 |
Año 2022 |
Año 2023 |
Año 2024 |
Año 2025 |
Año 2026 |
Año 2027 |
Año 2028 |
Año 2029 |
Año 2030 |
TOTAL 2020 - 2030 |
| 1° | 1 334 570 | 1 533 135 | 1 369 649 | 1 468 994 | 5 706 348 ton. | ||||||||
| 2° | 1 008 252 | 742 926 | 877 000 | 744 285 | 3 372 463 ton. | ||||||||
| 3° | 723 000 | 704 000 | 763 000 | 618 400 | 2 808 400 ton. | ||||||||
| 4° | 359 695 | 499 536 | 518 480 | 491 768 | 1 869 479 ton. | ||||||||
| 5° | 371 491 | 230 187 | 180 256 | 99 789 | 881 723 ton. | ||||||||
| 6° | 173 167 | 157 778 | 150 897 | 190 928 | 672 770 ton. | ||||||||
| 7° | 57 700 | 45 000 | 52 000 | 60 000 | 214 700 ton. | ||||||||
| 8° | 27 000 | 32 000 | 28 200 | 30 000 | 117 200 ton. | ||||||||
| 9° | 28 662 | 27 915 | 24 092 | 22 059 | 102 728 ton. | ||||||||
| 10° | 2 361 | 4 896 | 5 485 | 10 837 | 23 579 ton. | ||||||||
| 11° | 8 569 | 6 187 | 3 893 | 3 233 | 21 882 ton. | ||||||||
| Fuente : British Geological Survey (Servicio Geológico Británico) [4] | |||||||||||||
Véase también
- Departamentos productores de zinc de Bolivia
- Departamentos productores de zinc del Perú
- Regiones productoras de zinc de Chile
- Países productores de estaño a nivel mundial
- Países productores de cobre a nivel mundial
- Países productores de plata a nivel mundial
- Países productores de plomo a nivel mundial
- Países productores de oro a nivel mundial
- Países productores de petróleo a nivel mundial
- Países productores de gas natural a nivel mundial
- Países productores de cemento a nivel mundial
Referencias
- ↑ a b Servicio Geológico de Estados Unidos (2023). «Países Productores de Zinc a Nivel Mundial» (PDF). usgs.gov. Consultado el 15 de abril de 2023.
- ↑ Servicio Geológico Británico. «Países Productores de Zinc a Nivel Mundial» (PDF). nora.nerc.ac.uk. p. 77. Consultado el 26 de abril de 2025.
- ↑ «Población de los países del mundo en el año 2022». datos.bancomundial.org. 2022. Consultado el 2 de mayo de 2024.
- ↑ Servicio Geológico Británico (31 de marzo de 2024). «Países Productores de Cobre durante la década de 2020». www2.bgs.ac.uk (en inglés). Consultado el 5 de febrero de 2025.
| Control de autoridades |
|
|---|
 Datos: Q1860811